Botswana has just celebrated its 59th year of independence. As six decades of independence approaches, it is a good time to reflect on the economic progress made so far. More so with the noise in the market regarding government revenues. Have we made economic progress, and has the growth now tanked? What can we learn from history? Can the SMEs have a role to play in creating economic headwinds and diversification?
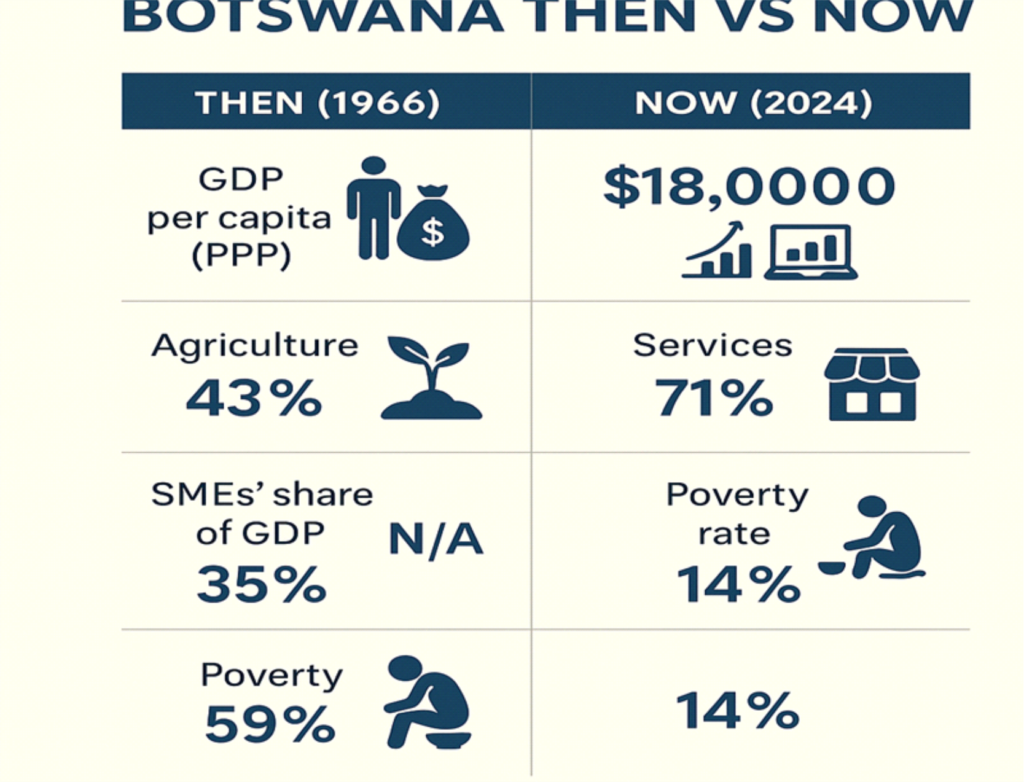
When Botswana gained independence from Britain in 1966, it was one of the poorest nations on earth, with a GDP per capita of just US$70. Today, it’s an upper-middle-income country with GDP per capita around US$18,000 (Purchasing Power Parity), a 250-fold increase. But is everyone benefiting equally? And what’s next for the economy?
Below is a summary of the economic transformation of Botswana over the years.
We will deep diver into the trends, highlighting how Batswana have faired over the years.
The Journey: From Poverty to Prosperity
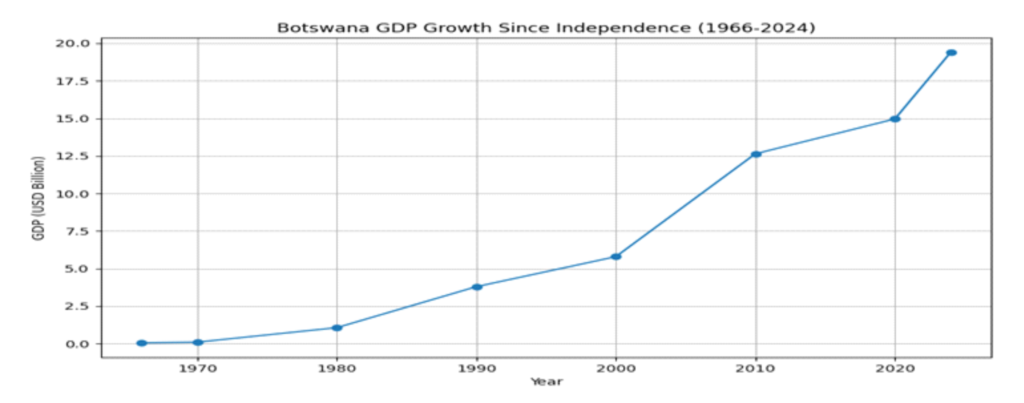
Botswana’s GDP has grown from $51 million in 1966 to $19.4 billion in 2024. That’s not just growth, it’s transformation. The real GDP CAGR for Botswana from 1966 to 2024 is approximately 7.30% per year. Such growth is commendable, even though starting on a low base. Below is a graph showing the meteoric rise of Botswana’s GDP over the past 58 years.
Structural Shift: Diamonds Built the Base, Services Drive the Future
At independence, Botswana was an agrarian economy. Agriculture contributed 43% to GDO in 1966. Mining was nonexistent. The economy shifted with the discovery of diamonds in the 1970s. Below is a graph showing the transformation of key economic sectors from independence to now.
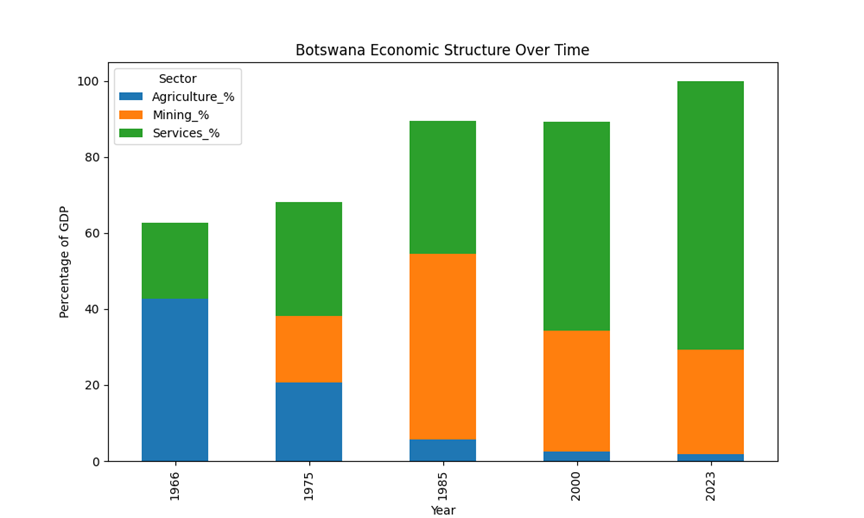
Services now dominate the economy whilst agriculture is hardly 2% of GDP. However, the country has become more food insecure. It now largely depends on imports to feed itself. Mining rose from 0% at independence to a dominant 48.9% in 1985 and trended downwards now 27.5%. The service industry has expanded from 20% at independence and currently sits at 70.6%. The engine drivers are finance, ICT and tourism.
Are Batswana Becoming Richer?
The growth of the Botswana economy is impressive, and the country has been lauded as one of Africa’s success stories. The transformation of the economy is also self-evident, with services now dominating the economy. But are Batswana becoming richer? The answer is Yes and no. Why do I say so. Yes, because the economy has grown incredibly well with Botswana’s GDP per capita (PPP) standing at $18,069, close to Brazil and Malaysia. But extreme poverty is ~13.7% (2024), inequality remains high (Gini ≈0.52), and unemployment is around 27%.
The Botswana’s GDP per capita (PPP) of $18,069 compares lower to the Upper Middle-Income Countries (UMIC) average of $21,550. This means we are trending lower to our peers. We are living below our potential. Further, the growth is not broadly shared. The poverty level for Botswana of 13.5% is almost 10% higher than the UMIC average of ~3–4%. Further, the inequality measured by the Gini coefficient scores Botswana’s at above 0.50 versus the UMIC median of approximately 0.38. This means we have unacceptably high levels of inequality as compared to other UMIC. The growth is skewed towards the richer.
SMEs: The Unsung Heroes
SMEs currently contribute 35% of GDP and 50% of formal jobs. They are the backbone of diversification, especially in retail, services, and agro-processing. Yet, they face limited access to finance, skills gaps, and infrastructure challenges. Below is a synopsis of how SMEs have evolved over the years.
- Historical Growth of SMEs
SMEs have evolved significantly since independence, moving from informal, agriculture-based enterprises to a diverse ecosystem spanning services, manufacturing, and ICT. Their growth trajectory can be summarized as follows:
- Pre-1990s: SMEs were mostly informal, concentrated in agriculture and small-scale retail, contributing less than 10% of GDP.
- 1990s–2000s: Government programs like the Financial Assistance Policy (FAP) and CEDA boosted SME formation. Contribution rose to 15–20% of GDP and about 30% of employment.
- 2010s: Economic Diversification Drive (EDD) and National Development Plans expanded SME roles in manufacturing, tourism, and services. Contribution reached 30% of GDP and 45% of employment.
- 2020s: SMEs now account for over 90% of registered businesses, contribute 35% of GDP, and employ 50% of the workforce. Growth accelerated under Citizen Economic Empowerment and ERTP post-COVID.
This growth in SME impact shows the importance of government policy in stimulating SMEs.
b. Sectoral Evolution
Agriculture: Dominant in early decades, now smaller but still vital for rural SMEs.
Retail & Trade: Consistently the largest SME segment.
Services: Fastest-growing—tourism, transport, ICT, and professional services.
Manufacturing: Gradual growth in agro-processing, textiles, and light industry.
ICT & Digital: Emerging strongly since 2015 under SmartBots strategy.
Key Drivers of Growth
• Access to credit (CEDA, Youth Development Fund).
• Government procurement policies favoring citizen-owned SMEs.
• Digital adoption and e-commerce platforms.
• Regional trade opportunities (SADC market).
Call for Action
As we navigate the difficult economic terrain, SMEs need to be part of the conversation. We laud the government for putting in place business friendly policies over the years. But more can be done now to crowd out SMEs in the growth agenda. A strong private sector leads to more growth. This growth however needs to be broad based to uplift more Batswana out of poverty. Generally, we have obtained better outcomes, and Batswana are now richer. However, we are living below our potential. More needs to be done to realise that potential.